


")


 Calculator Template")


: What It Is and How to Calculate")


How does your business track its financial health? Whether you’re a startup owner or an experienced CFO, financial analysis is key to making smart decisions. It shows you where to grow, where to be cautious, and how to plan for the future.
For example, cash flow trends can help a business avoid running out of money, and profitability ratios can show where the business may be wasting resources or not performing well.
In this blog, we will explore the key types of financial analysis. We will also look at how these methods work in real life and how tools can make the process easier for your business.
Understanding Financial Analysis
Financial analysis helps businesses understand their financial health. It looks at key reports like the income statement, balance sheet, and cash flow statement to show where money is coming from, where it’s going, and what changes might be needed.
Businesses use financial analysis to:
- Measure profitability – How much money is left after covering all expenses?
- Check efficiency – Is the business using its resources wisely?
- Find growth opportunities – Where can the company improve or expand?
- Manage risks – Are there financial warning signs, like high debt or slow payments?
Example: A bakery owner looks at their sales report and notices that cakes generate more profit than cookies. They decide to promote cake sales more and reduce production costs for cookies. Over time, this helps increase overall profits.
Once you understand the basics, the next step is to review financial statements. These reports provide businesses with the details they need to make informed decisions.
Key Financial Statements in Analysis
Tracking financial health isn’t just about checking bank balances. Without clear reports, it’s hard to tell if a business is making money, overspending, or heading toward financial trouble. Financial statements give a complete picture of a company’s financial position. Here are the four key reports every business needs to understand:
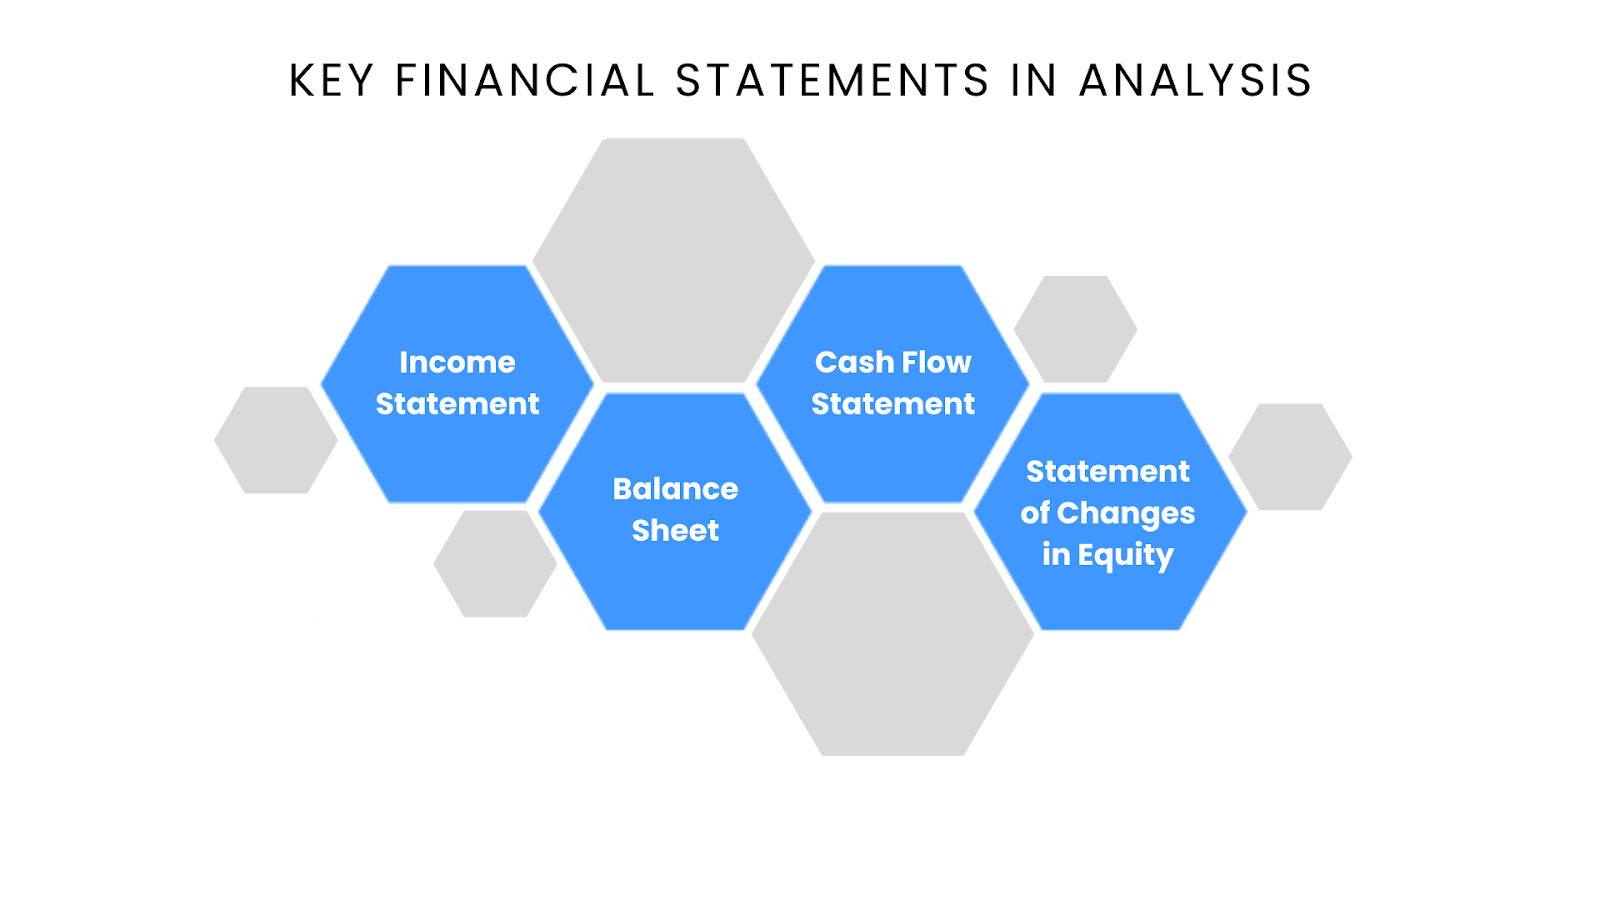
1. Income Statement
The income statement shows how much money a business makes and spends over a period. It lists total revenue, operating costs, and net profit.
- Purpose: Measures profitability and operating efficiency.
- Example: A business earns $500,000 in sales and spends $400,000 on expenses, leaving a net income of $100,000. If profits are low, the owner might consider reducing costs or increasing prices.
This report helps businesses see if they are truly profitable or just breaking even.
2. Balance Sheet
The balance sheet shows what a company owns and owes at a specific time. It lists assets (what the company owns), liabilities (debts and expenses), and equity (owner’s share).
- Purpose: Assesses financial stability and debt levels.
- Example: A company has $1 million in assets but owes $700,000 in liabilities, leaving $300,000 in equity. If debts are too high, the company may need better cash flow management.
This statement is essential for understanding financial health and long-term stability.
3. Cash Flow Statement
The cash flow statement tracks how money moves in and out of a business. It helps businesses understand if they have enough cash to cover expenses.
- Purpose: Ensures the company can meet its short-term financial needs.
- Example: A business has a positive cash flow of $50,000, meaning it generates enough money from daily operations. If cash flow is negative, the company might need to speed up customer payments or delay expenses.
This report is key to avoiding cash shortages that could disrupt operations.
4. Statement of Changes in Equity
This report explains how a company’s value changes over time. It tracks profits, dividend payments, and other financial adjustments.
- Purpose: Shows how much of the business’s profits are reinvested or distributed to owners.
- Example: If a company makes $200,000 in profit and pays $20,000 in dividends, the remaining $180,000 increases equity.
This statement is useful for investors and business owners who want to see how profits are managed.
To truly understand financial performance, businesses use different financial analysis methods to break down these reports and uncover deeper insights. Let’s explore the key methods that help businesses make smarter financial decisions.
Types of Financial Analysis Methods
Financial analysis helps businesses understand their finances. It shows where money is going, tracks change over time, and helps plan for the future. Here are four simple ways businesses analyze financial data.
1. Vertical Analysis
Vertical analysis looks at each item in a financial statement as a percentage of the total. This helps businesses see which costs are too high.
Example: A retail store checks its income statement and finds that rent is 18% of total revenue. Similar businesses spend around 12% on rent. This shows they are paying too much, so they negotiate a better lease.
Why It Helps: Businesses can compare costs with industry averages and decide where to cut expenses.
2. Horizontal Analysis
Horizontal analysis compares financial data over different time periods. It helps businesses track growth and spot problems early.
Example: A company looks at revenue from the past five years. Sales grew 10% per year, but this year they only grew 2%. After investigating, they find that a new competitor is affecting sales. They adjust pricing and marketing to stay competitive.
Why It Helps: This method helps businesses react to changes before they become bigger issues.
3. Ratio Analysis
Ratio analysis compares numbers from financial statements to measure profitability, efficiency, and financial health.
- Profitability Ratios – Show how much profit remains after covering costs.
- Liquidity Ratios – Measure if a company can pay its short-term bills.
- Efficiency Ratios – Show how well a business uses resources.
Example: A business calculates its current ratio (current assets ÷ current liabilities) and gets 1.2:1. This means it has $1.20 in assets for every $1.00 in debt. While this is good, they decided to build more cash reserves to be safer.
Why It Helps: Ratio analysis gives businesses a quick way to check their financial health and compare it to industry standards.
4. Cash Flow Analysis
Cash flow analysis tracks money coming in and going out. A company can be profitable but still struggle with cash if it doesn’t manage payments well.
Example: A manufacturing business has strong sales but struggles to pay suppliers. They check their cash flow statement and see that customers take too long to pay invoices. To fix this, they offer early payment discounts and improve payment terms.
Why It Helps: Tracking cash flow helps businesses make sure they always have enough money for daily operations.
Understanding these methods is the first step. Next, businesses need the right tools to analyze data quickly and make informed decisions.
Tools and Techniques for Financial Analysis
Numbers alone don’t always show the full picture. Businesses need the right tools to organize financial data, track trends, and plan for the future. These tools help manage costs, improve profits, and prepare for risks. Here’s how they work.
1. Common-Size Financial Statements
This method turns financial numbers into percentages. It helps businesses compare their expenses to industry standards or past performance.
Example: A company finds that operating costs make up 40% of revenue, while competitors spend 30%. This means they may need to cut expenses or increase efficiency.
Why It Helps: Businesses can quickly see if they are overspending and adjust before it affects profits.
2. Trend Analysis Tools
Trend analysis tracks financial data over time. It helps businesses find patterns, measure progress, and spot risks before they grow.
Example: A company sees that profit margins have fallen for three years in a row. After reviewing costs, they realize raw material prices have increased. To fix this, they negotiate better rates with suppliers.
Why It Helps: Catching negative trends early gives businesses time to adjust before problems get worse.
3. Forecasting Models
Forecasting uses past data to predict future financial outcomes. It helps businesses set budgets, manage cash flow, and plan for seasonal changes.
Example: A retailer predicts a sales spike during the holiday season. To prepare, they stock extra inventory and hire more staff.
Why It Helps: Businesses can plan ahead, avoid cash shortages, and meet customer demand.
4. Scenario and Sensitivity Tools
These tools help businesses plan for different financial situations. Scenario analysis looks at best- and worst-case outcomes, while sensitivity analysis tests how small changes affect profits.
Example: A company runs a sensitivity analysis and finds that a 15% rise in raw material costs would cut profits in half. To prevent this, they start looking for alternative suppliers.
Why It Helps: Planning for different situations helps businesses stay stable, even when unexpected costs arise.
Practical Applications of Financial Analysis
Financial analysis helps businesses make smart decisions. It shows where money comes from, where it goes, and what needs to change. Companies use it to manage budgets, track progress, reduce risks, and plan for growth. Here’s how businesses use financial analysis in real life.
1. Making Investment Decisions
Before spending money on new projects, businesses analyze the costs and expected profits. This helps them decide if an investment is worth it.
Example: A software company wants to launch a new product. It reviews costs, sales estimates, and expected profits. The data shows it will be profitable in two years. With this insight, they move forward.
Why It Helps: It prevents businesses from spending money on projects that may not succeed.
2. Managing Financial Risks
Unexpected problems, like rising costs or losing a major customer, can harm a business. Financial analysis helps companies see risks early and take action.
Example: A company sees that 60% of its revenue comes from one customer. If that customer leaves, they will struggle. To reduce risk, they find new customers and expand their income sources.
Why It Helps: Businesses can prepare for problems before they happen.
3. Planning for Business Growth
Growing a business takes planning. Financial analysis helps companies decide when and where to expand.
Example: A restaurant chain compares profits from different locations. City locations make more money than suburban ones, so they decide to open new branches in busy city areas.
Why It Helps: Businesses can grow in the right place at the right time.
4. Measuring Business Performance
Tracking performance shows what’s working and what needs to change. Businesses compare financial data over time to spot problems early.
Example: A factory finds that production costs are higher than competitors. After checking, they see that inefficient processes are the cause. Fixing them lowers costs and increases profits.
Why It Helps: Businesses can make changes before problems get worse.
5. Budgeting and Forecasting
Companies use financial analysis to plan their expenses and predict future revenue. This helps them avoid cash shortages and manage growth.
Example: A retail store looks at past sales and notices higher demand every December. To prepare, they order extra inventory before the holiday season.
Why It Helps: Forecasting helps businesses prepare for busy seasons and avoid running out of stock.
How Peakflo Makes Financial Analysis Easier
Managing finances can take up too much time. Peakflo makes it simple by automating key tasks, giving real-time insights, and working smoothly with accounting systems. Doesn’t matter if you need to send invoices, track expenses, or plan cash flow. Peakflo helps you stay in control.

1. Send Invoices and Collect Payments Faster
Late payments can slow down your business. Peakflo’s invoicing automation sends invoices and reminders automatically. This helps businesses get paid on time and keep cash flow steady without constant follow-ups.
2. See Your Finances in One Place
Manually checking reports can take hours. Peakflo’s financial dashboards give a real-time view of revenue, expenses, and overdue payments. Businesses can track trends, find issues early, and make informed decisions quickly.
3. Plan Ahead with Cash Flow Forecasting
Running out of cash can create big problems. Peakflo’s cash flow forecasting predicts future income and expenses based on past transactions. This helps businesses plan for payments, avoid shortfalls, and manage budgets with confidence.
4. Track Expenses Without the Hassle
Keeping up with expenses across teams can be difficult. Peakflo’s expense management tools sort and track expenses automatically. This makes it easier to control spending, stay within budget, and avoid unnecessary costs.
5. Get Insights That Help You Grow
Looking at numbers alone isn’t enough. Peakflo’s AI-powered insights show businesses where they can improve cash flow, reduce risks, and make better financial decisions.
Peakflo makes financial management easier. By automating invoices, tracking expenses, and providing real-time insights, businesses can save time, reduce errors, and make better decisions. Whether you want to improve cash flow, cut costs, or speed up payments, Peakflo has the right tools.
Conclusion
Keeping track of finances is more than just looking at numbers. It helps businesses understand where their money is going, spot problems early, and plan for the future. Whether it’s checking cash flow, measuring profits, or managing expenses, financial analysis makes decision-making easier.
But doing everything manually takes time and increases the risk of mistakes. That’s why businesses use Peakflo. It automates invoicing, tracks payments, and gives real-time financial insights—so you always know where your business stands. With tools for cash flow forecasting, expense tracking, and easy reconciliation, you can manage finances without stress.
Want to save time and improve cash flow? Book a demo of Peakflo to learn how it can help you make better financial decisions and clarify your business’s finances.

